
Inconvenient Deaths
How the return to baseline reveals the hidden excess


Dr Clare Craig FRCPath
The 2025 death registration data for England is now available. It offers a chance to revisit a benchmark: the ONS 2018 population and mortality projections, published before the pandemic, before lockdown, and before any changes in methodology.
According to those projections, deaths would rise gradually through the 2020s, largely due to population ageing. That baseline is helpful because it was published before recent political and methodological pressures began to interfere and already accounted for ageing and population growth. In 2023, the ONS adopted a new model for estimating expected deaths. It was introduced formally in February and used for all outputs from mid-year onward. Since 2023, it has predicted a total of 68,500 more deaths than were registered. Having such a high expectation for death means a significant death event could be disguised as normal.
The new data shows that total annual deaths in 2024 and 2025 returned almost exactly to the levels projected in 2018. The implication is clear. There was an excess in 2022 and 2023 which cannot be easily accounted for. Some deaths registered in early 2023 reflect events in late 2022, but this artefact affects all years to a varying degree.
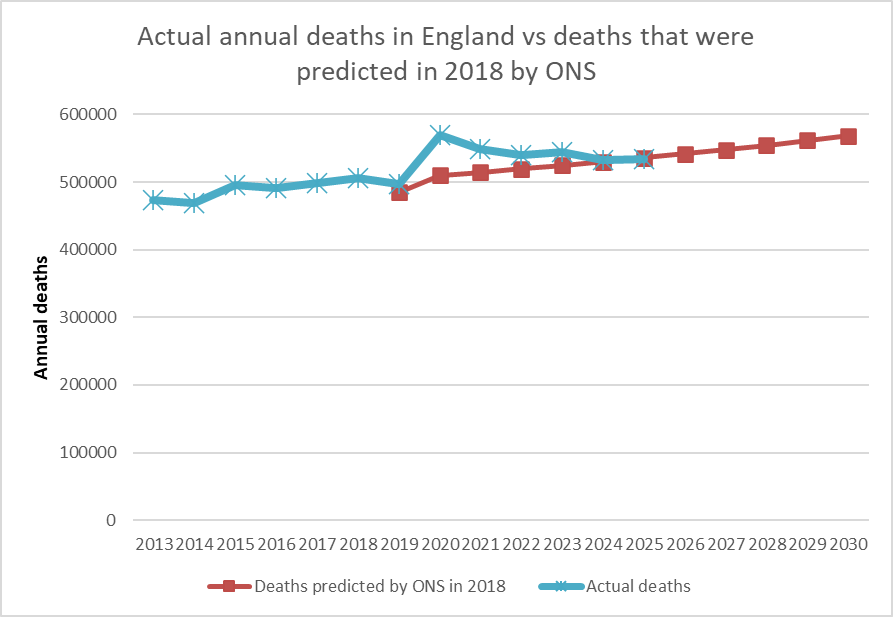
Figure 1: Actual annual deaths in England vs ONS projections from 2018
The Missing Deficit
Excess mortality was widely reported in 2020, 2021, and even 2022, despite the low mortality attributed to the Omicron variant of covid. These deaths mostly affected the frail and those near the end of life. Therefore, with those expected to die having already died, subsequent years should have seen lower mortality.
There is no indication of that pattern here. The mortality rate for over-85s in 2025 is close to its 2016–2019 trend. The most likely explanation is that there are additional causes of mortality making up the difference.
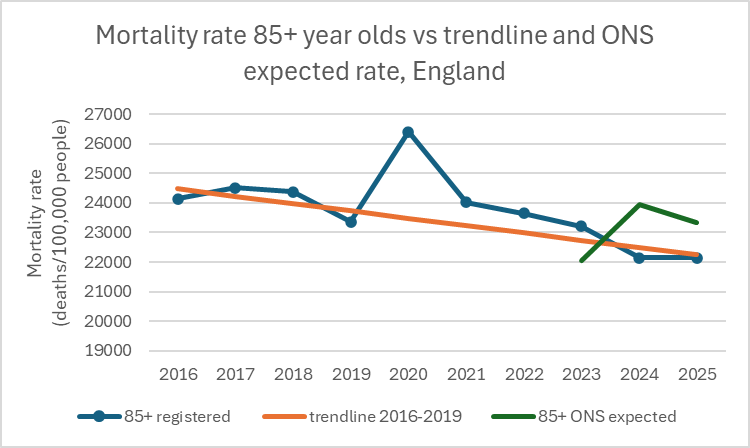
Figure 2: Mortality rate for 85+ year-olds vs trend and ONS predicted rate using the new 2023 modelling methodology
The same applies to those aged 75–84. The ONS expected death rate for this group in 2024 was high, with only a modest downward correction for 2025. In contrast, the actual data returned to trend more quickly.
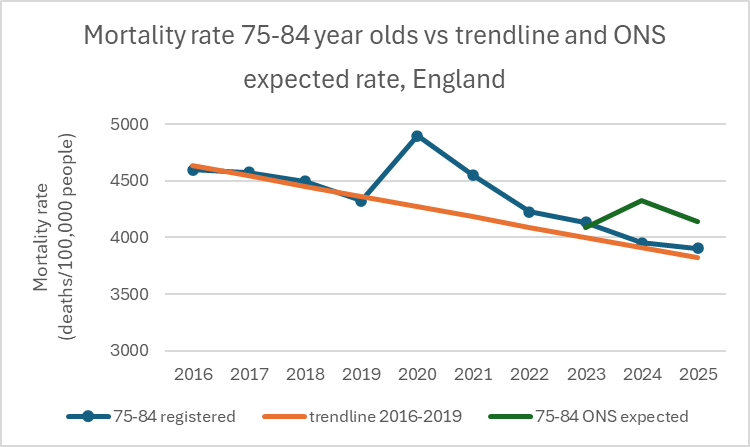
Figure 3: Mortality rate for 75-84 year-olds vs trend and ONS expected rate
Among 65–74 year olds, the first signs of a deficit only emerged in 2025 – too late, and too small, to account for the cumulative excess since 2020. In the meantime, the ONS expected levels remained very high.
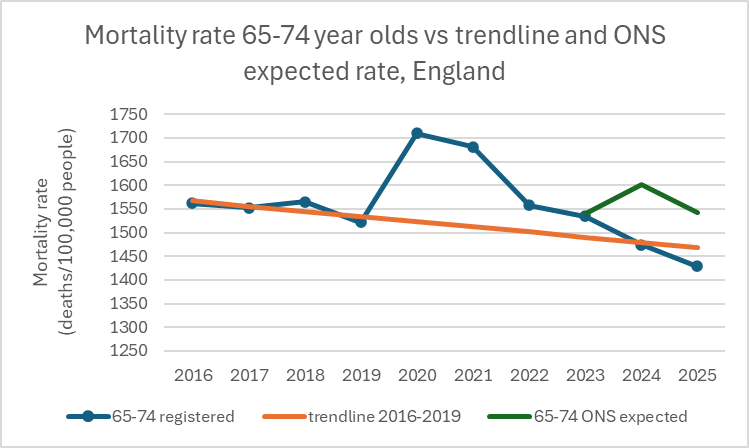
Figure 4: Mortality rate for 65-74 year-olds vs trend and ONS expected rate
For 50–64 year olds, excess mortality persisted well into 2024 and 2025. In proportional terms, this group experienced the largest cumulative deviation but not as large as the ONS were prepared to accept as normal.
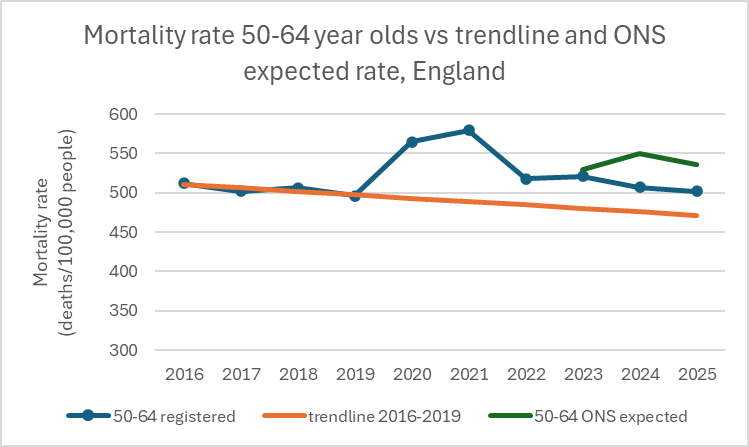
Figure 5: Mortality rate for 50-64 year-olds vs trend and ONS expected rate
Younger adults (25–49) saw a spike in 2021–2022, followed by a return to pre-pandemic trend. In these working-age groups, the ONS adjusted its expectations upwards, rather than recognising the anomaly.
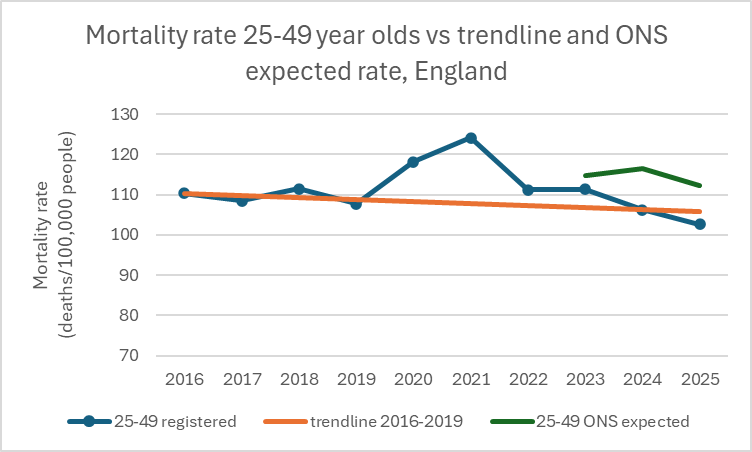
Figure 6: Mortality rate for 25-49 year-olds vs trend and ONS expected rate
Finally, the youngest age group 0-24 year olds have low mortality which is volatile year to year. Even so, the ONS model applies a smooth upward adjustment to expected deaths in this group through 2024 and 2025. There is no demographic or epidemiological justification for this.
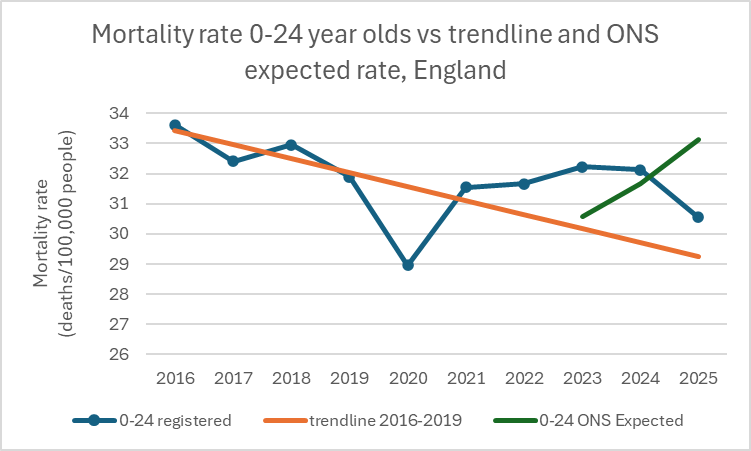
Figure 7: Mortality rate for 0-24 year-olds vs trend and ONS expected rate
After excluding COVID waves, the ONS trend-based model amplifies residual fluctuations around 2020–2021 and interprets them as a rising baseline, leading to an upward projection of expected deaths. This was most extreme in the youngest age group because of their low level of deaths in 2020.
How Excess Becomes Baseline
In 2023, the ONS adopted a new model for estimating expected deaths and the Office for Health Disparities and every other body producing analysis all adopted it. It combined trends from regions, age groups, and national aggregates, using data from the excess period itself as input. This approach embedded recent mortality increases into future projections, producing what appears as a smooth upward curve.
Instead of defining excess as a departure from trend, the model treats the trend as variable and recent deaths as part of the new normal. The historic rise therefore leads to the assumption of a continuing rise. The result resembles a classic artefact of trend fitting: the hockey stick.
This change is documented in HART’s February 2024 analysis. Discrepancies were largest in middle-aged and younger groups where baseline mortality is typically stable year to year.
Misalignment of Cause and Timing
Excess mortality did not follow the expected demographic gradient of a respiratory pandemic. Instead, deaths concentrated in younger adults after 2021, particularly in groups not previously affected. These cannot be dismissed as due to “the virus”.
Furthermore, although much of the excess in 2022 and 2023 was not uniform throughout the year in older age groups, instead following covid waves, that does not mean that the vaccines did not contribute. A proportion of the vaccinated had increased immune related risk from covid and there are multiple other reasons why people died during covid waves in a preventable way.
Redefining excess deaths as expected deaths carries institutional advantages. Once excess is declared resolved, there is no need to investigate mechanisms. Rising mortality in younger cohorts should signal an anomaly but it is ignored when it conforms to modelled projections.
Return to Trend, Not to Normal
Despite methodological manipulation, observed death rates in 2025 are now aligning with the pre-pandemic ONS forecasts in most age groups but there is a continuing excess for those aged 50-64 years old. The lack of excess in older age groups may be being hidden by a deficit following significant excess. As for the youngest age group, the continuing excess deaths have been ignored by a completely inexplicable ONS model predicting a sharp rise in deaths for 0-24s in 2024 and 2025. Trying to tease out the causes of the excess deaths is impossible as cause of death by age group is not currently available.
Really interesting. Thank you for explaining so clearly.
2022 and 2023? Excess death, esp. for old fogies, looks to me to have begun in late 2019!